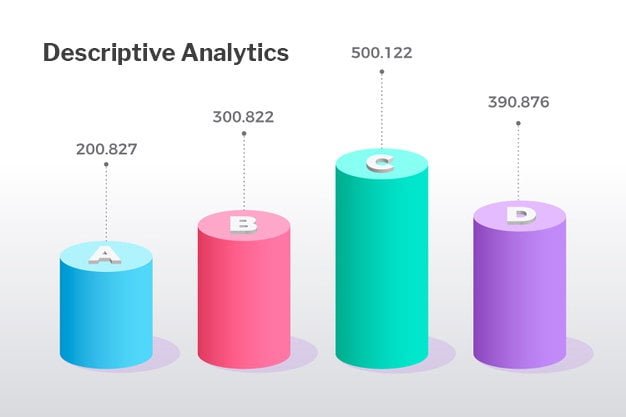
Descriptive Analytics
Descriptive Analytics is the technique of data mining in which experts and professionals work on historical data and make analysis explaining what incidents have occurred in the past. It has been derived from word Describe. Data Analytics is communicated in the form of charts, graphs, calculations and dashboard. Descriptive Analytics focusses on simple statical techniques to summarise the dataset and better analysis.
Descriptive analytics is basically the management reports which provides information regarding sales, marketing strategy, customer behaviour, operations, finance and relations among the various variables. Amazon Prime, for example, uses descriptive analytics to find correlations among various movies that subscribers watch and to improve their recommendations engine they use for sales and customer data.
The descriptive analytics focuses mainly on two regions, Inferential statistics and predictive analysis. Inferential statistics draw a conclusion about a population based on a sample of data. Predictive Analysis focuses to forecast future trends and outcomes.
Main steps involved in descriptive analytics are:
- Data Visualisation- This involves data plotted between different variables to depict the clear image of the data.
- Multi-variable analysis- This analysis involves different statical instruments such as mean, median, mode, standard deviation, range, variance, regression and correlations. Using these methods, one can easily calculate variable summary, the relationship between variables and variable identifications.
The main drawbacks of descriptive analytic are it does not provide any inference about data set using probability theory. Descriptive analytic is, therefore, an important source to predict and understand what to do next and with predictive analytics such data can be turned into useful information about the future outcomes.
Advantages of Descriptive analytics:
Descriptive analytic helps to gain lots of information and performance of the business that would otherwise not be known. Here are some advantages of using descriptive analytics in data analytics:
- It helps to predict quickly and easily the Return of Investment (ROI) by showing how the performance or goals can be achieved.
- It help to identify problems quickly and fill the gaps and issue in the early stage.
- It helps to analyse potential customers in order to gain positive response and additional resources.
- It analyse the value and impact of data on the business.
Role of descriptive analytics:
Descriptive analytics plays a major role in these fields:
Static Business metrics: Descriptive analytics evaluate the important metrics which are important for evaluating performance against business goals. These goals would help to increase the revenue, reduce cost, improve performance and measure productivity.
Identify the data required: Business data are located in many locations. These locations include systems of records, databases, and desktops. To measure them accurately, companies must prepare the correct data sources to extract the useful information saved on these locations.
Extract and prepare data: Descriptive analytics uses deduplication, transformation, and cleansing which are important steps of data preparation. Although the process is time-consuming and labor intensive process it is critical for data accuracy.
Data analysis: Data analytics uses different models such as summary statistics, clustering and regression analytics to measure the performance and determine the necessary patterns. A data scientist uses various tools like R and Python to analyse and visualise data.
Present data: Descriptive analytics display results in the form of charts and graphs. this is where data visualisation comes into play. Business Analytics gives users an ability to present data visually so that it can easily be read and understood by non-data analyst.
